The Insider's Playbook to Mastering Amazon Marketing Cloud SQL

Amazon Advertising AMC SQL Unveiled: Tips, Tricks, and Hidden Features
One of the barriers to getting started with Amazon Ads Marketing Cloud is understanding the data and how to write AMC SQL. The datasets are complex, and AMC SQL has a steep learning curve.
Ultimately, the goal of tapping into AMC data is to refine advertising strategy, have a deeper insight into AMC audiences and segments, and create a feedback loop where you have the capabilities to create actionable insights rapidly to optimize advertising campaigns.
Amazon Marketing Cloud AI Copilot
This post demonstrates various examples of AMC SQL queries and how to gain free access to an AMC SQL Data Analyst AI copilot.
Using An AMC AI Data Copilot!
Most people interested in AMC are not data scientists or software engineers with the skills to author structured query language (SQL) queries against complex AMC data.
To lower barriers and increase velocity with AMC, we released “Chatlytics,” a free Amazon Marketing Cloud data analyst AI copilot trained on all things Amazon Marketing Cloud SQL. Using the Chatlytics data analyst copilot is as simple as starting a conversation about your AMC query or dataset.
When you're stuck hunting down a SQL error or exploring new ways to create insights, ask the AMC AI Data Analyst Copilot*.
*This post's SQL, analysis, and visualizations were all developed in collaboration with the AMC SQL AI Copilot!
Sponsored Ads Traffic AMC SQL
AMC covers Amazon DSP, Amazon Sponsored Ads (like Sponsored Products), Amazon Attribution, and other AMC data sets. In this example is a query for retrieving impressions, clicks, and spending metrics for Sponsored Products and Sponsored brand campaigns from the sponsored_ads_traffic table:
SELECT
    ad_product_type,
    targeting,
    customer_search_term,
    match_type,
    SUM(spend)/100000000 AS total_cost_dollars,
    ((SUM(spend)/100000000)/SUM(impressions))*1000 AS avg_cpm,
    SUM(impressions) AS impressions,
    SUM(clicks) AS clicks,
    (SUM(clicks)/SUM(impressions)) AS ctr
FROM
    sponsored_ads_traffic
WHERE
    match_type IN('PHRASE', 'BROAD', 'EXACT')
GROUP BY
    ad_product_type, targeting, customer_search_term, match_type
This query calculates total spend in dollars, the average cost per thousand impressions (avg_cpm), total impressions, total clicks, and click-through rate (ctr) for Sponsored Products and Sponsored Brands campaigns. The query filters data for specific match types (PHRASE, BROAD, EXACT) and groups the results by ad_product_type, targeting, customer_search_term, and match_type .
Based on the Openbridge knowledge base, here are five instructional AMC SQL queries designed to cover a range of fundamental concepts and operations in AMC SQL. These queries offer a structured approach to learning AMC SQL, focusing on different aspects such as aggregation, join operations, conditional logic, and advanced analytics.
Aggregate Impressions and Clicks by Campaign:
SELECT
  SUM(c.clicks) AS total_clicks,
  COALESCE(SUM(a.conversions), 0) AS total_conversions
FROM dsp_clicks c
LEFT JOIN amazon_attributed_events_by_conversion_time a ON c.request_tag = a.request_tag
DSP Clicks advertiser performance, campaign details, and cost efficiency
Here's an instructional AMC SQL example query for analyzing DSP (Demand Side Platform) clicks data focusing on advertiser performance, campaign details, and cost efficiency. This query aims to aggregate click data by advertiser, campaign, and device type, offering insights into the effectiveness of different campaigns and the devices on which they perform best.
SELECT
  advertiser,
  campaign,
  device_type,
  COUNT(clicks) AS total_clicks, -- Aggregating the total number of clicks
  SUM(click_cost)/100000 AS total_click_cost_dollars, -- Convert click cost from millicents to dollars
  AVG(click_cost)/100 AS avg_click_cost_cents, -- Calculate average click cost in cents
  MAX(click_cost)/100 AS max_click_cost_cents, -- Identify the maximum click cost in cents for benchmarking
  MIN(click_cost)/100 AS min_click_cost_cents -- Find the minimum click cost in cents for optimization opportunities
FROM
  dsp_clicks
GROUP BY
  advertiser,
  campaign,
  device_type
This query performs the following operations:
- Groups, the DSP clicks data by advertiser, campaign, and device type to analyze performance across these dimensions.
- Counts the total number of clicks (total_clicks) for each group to measure engagement.
- Calculate the total click cost in dollars (total_click_cost_dollars), converting from millicents to ensure the cost is easily interpretable.
- Computes the average, maximum, and minimum click costs (avg_click_cost_cents, max_click_cost_cents, min_click_cost_cents), providing insights into cost variability and efficiency across campaigns.
DSP Impresssion and DSP Clicks
Here's an instructional AMC SQL example for an analysis that combines DSP impressions and clicks data to evaluate campaign performance, including impressions, clicks, and click-through rate (CTR). This query joins the dsp_impressions and dsp_clicks tables on campaign and advertiser IDs, providing a comprehensive view of campaign effectiveness across different devices and browsers.
WITH impressions AS (
  SELECT
    advertiser_id,
    campaign_id,
    device_type,
    COUNT(impression_date) AS total_impressions -- Assuming 'impression_date' can represent each unique impression
  FROM
    dsp_impressions
  GROUP BY
    advertiser_id,
    campaign_id,
    device_type
),
clicks AS (
  SELECT
    advertiser_id,
    campaign_id,
    COUNT(click_date) AS total_clicks -- Assuming 'click_date' can represent each unique click
  FROM
    dsp_clicks
  GROUP BY
    advertiser_id,
    campaign_id
),
combined_data AS (
  SELECT
    i.advertiser_id,
    i.campaign_id,
    i.device_type,
    i.total_impressions,
    COALESCE(c.total_clicks, 0) AS total_clicks
  FROM
    impressions i
  LEFT JOIN
    clicks c ON i.advertiser_id = c.advertiser_id AND i.campaign_id = c.campaign_id
)

SELECT
  advertiser_id,
  campaign_id,
  device_type,
  total_impressions,
  total_clicks,
  CASE
    WHEN total_impressions > 0 THEN ROUND((total_clicks / total_impressions) * 100, 2)
    ELSE 0
  END AS ctr
FROM
  combined_data
In this query, we:
- Create separate CTEs (impressions and clicks) to aggregate total impressions and clicks by advertiser_id and campaign_id, counting occurrences based on the existence of impression_date and click_date, respectively.
- Join these CTEs in combined_data to align clicks with their corresponding impressions.
- Calculate the CTR as (total_clicks / total_impressions) * 100, rounding to two decimal places where applicable, with safeguards against division by zero.
This approach ensures compliance with AMC’s SQL requirements and provides an analysis framework for DSP campaign performance across different device types.
To extend the approach to include dsp_views dsp_impressions and dsp_clicks, creating a more comprehensive analysis of DSP data, we'll introduce another CTE for views. This will aggregate total views alongside impressions and clicks for each campaign and advertiser. This updated query will provide insights into how many impressions and clicks each campaign received and how many impressions were viewable.
WITH impressions AS (
  SELECT
    advertiser_id,
    campaign_id,
    device_type,
    COUNT(impression_date) AS total_impressions -- Assuming 'impression_date' represents each unique impression
  FROM
    dsp_impressions
  GROUP BY
    advertiser_id,
    campaign_id,
    device_type
),
clicks AS (
  SELECT
    advertiser_id,
    campaign_id,
    COUNT(click_date) AS total_clicks -- Assuming 'click_date' represents each unique click
  FROM
    dsp_clicks
  GROUP BY
    advertiser_id,
    campaign_id
),
views AS (
  SELECT
    advertiser_id,
    campaign_id,
    COUNT(event_date) AS total_views -- Assuming 'event_date' can represent each unique view
  FROM
    dsp_views
  GROUP BY
    advertiser_id,
    campaign_id
),
combined_data AS (
  SELECT
    i.advertiser_id,
    i.campaign_id,
    i.device_type,
    i.total_impressions,
    COALESCE(c.total_clicks, 0) AS total_clicks,
    COALESCE(v.total_views, 0) AS total_views
  FROM
    impressions i
  LEFT JOIN
    clicks c ON i.advertiser_id = c.advertiser_id AND i.campaign_id = c.campaign_id
  LEFT JOIN
    views v ON i.advertiser_id = v.advertiser_id AND i.campaign_id = v.campaign_id
)

SELECT
  advertiser_id,
  campaign_id,
  device_type,
  total_impressions,
  total_clicks,
  total_views,
  CASE
    WHEN total_impressions > 0 THEN ROUND((total_clicks / total_impressions) * 100, 2)
    ELSE 0
  END AS ctr,
  CASE
    WHEN total_impressions > 0 THEN ROUND((total_views / total_impressions) * 100, 2)
    ELSE 0
  END AS view_rate
FROM
  combined_data
This query includes:
- A CTE named views to count the total number of views (total_views) for each combination of advertiser_id and campaign_id.
- An updated combined_data CTE that joins the views data with impressions and clicks to align views alongside clicks and impressions for the same campaign and advertiser.
- Calculations for both CTR and view rate (view_rate), where view rate is defined as the percentage of viewable impressions using logic similar to CTR calculation.
The query offers a multi-dimensional view of DSP campaign performance, incorporating the engagement metrics (clicks) and the visibility of ads (views) across different devices. This enhanced analysis allows advertisers to understand which campaigns generate interactions and which are effectively reaching and being seen by the audience.
Calculating DSP Campaign and Sponsored Display Campaign Costs
Combining the principles from the DSP campaigns and Sponsored Display campaigns, the goal is to create a comprehensive query that calculates the costs for both types of campaigns in one unified view. This query will incorporate conversion from millicents and microcents to dollars for DSP ads and Sponsored Display ads, respectively, while accounting for the different billing strategies of CPC (Cost Per Click) and vCPM (Cost per thousand viewable impressions) for Sponsored Display.
-- DSP Campaigns Cost Calculation
WITH dsp_campaign_costs AS (
  SELECT
    CAST('DSP Campaign' AS VARCHAR(255)) AS campaign_type,
    CAST(campaign_id AS VARCHAR(255)) AS campaign_id,
    CAST(campaign AS VARCHAR(255)) AS campaign_name,
    CAST(currency_name AS VARCHAR(255)) AS currency_name,
    CAST(currency_iso_code AS VARCHAR(255)) AS currency_iso_code,
    CAST(SUM(impression_cost) / 100000.0 AS DECIMAL(10, 2)) AS impression_cost_dollars,
    CAST(SUM(total_cost) / 100000.0 AS DECIMAL(10, 2)) AS total_cost_dollars
  FROM
    dsp_impressions
  GROUP BY
    campaign_id, campaign, currency_name, currency_iso_code
),

-- Sponsored Display Campaigns Cost Calculation
sponsored_display_costs AS (
  SELECT
    CAST('Sponsored Display Campaign' AS VARCHAR(255)) AS campaign_type,
    CAST(NULL AS VARCHAR(255)) AS campaign_id, -- Explicitly casting NULL for campaign_id
    CAST(campaign AS VARCHAR(255)) AS campaign,
    CAST(NULL AS VARCHAR(255)) AS currency_name, -- Assuming uniform currency, explicitly casting NULL
    CAST(NULL AS VARCHAR(255)) AS currency_iso_code, -- Assuming uniform currency, explicitly casting NULL
    CAST(0.0 AS DECIMAL(10,2)) AS impression_cost_dollars, -- Placeholder for consistent column structure
    CAST(SUM(spend) / 100000000.0 AS DECIMAL(10, 2)) AS spend_dollars
  FROM
    sponsored_ads_traffic
  WHERE
    ad_product_type = 'sponsored_display'
  GROUP BY
    campaign
)

-- Final Selection with explicit casts to ensure data type consistency across UNION ALL
SELECT
  campaign_type,
  campaign_id,
  campaign_name,
  currency_name,
  currency_iso_code,
  impression_cost_dollars,
  total_cost_dollars
FROM
  dsp_campaign_costs

UNION ALL

SELECT
  campaign_type,
  campaign_id,
  campaign,
  currency_name,
  currency_iso_code,
  impression_cost_dollars,
  spend_dollars AS total_cost_dollars -- Matching the column name and data type in the SELECT above
FROM
  sponsored_display_costs
ORDER BY
  campaign_type, campaign_name;
- Explicit Data Type Specifications: All literals and NULL values are cast to VARCHAR(255) to ensure consistency across the UNION ALL operation. This includes campaign types, campaign IDs (where applicable), and currency fields.
- Decimal Calculations: Monetary values converted from microcents/millicents to dollars are explicitly cast as DECIMAL(10, 2) to ensure precise financial reporting and to match data types across the unioned parts.
- Placeholder Values for Sponsored Display: For columns in the Sponsored Display section that don’t have a direct counterpart in DSP campaigns (like currency_name, currency_iso_code, and impression_cost_dollars), placeholders are used with explicit casting to ensure column data type alignment.
Ad-attributed Branded Searches
Calculating the branded search rate and cost per branded search streamlines the analysis of ad-attributed branded searches. The objective is to create a comprehensive view that captures the branded search activity and offers insights into its efficiency and cost-effectiveness. The optimization simplifies data handling and ensures all calculations are done within a cohesive query structure.
WITH branded_searches AS (
  SELECT
    ae.campaign_id,
    ae.campaign,
    SUBSTRING(ae.tracked_item FROM 9) AS keyword, -- Extracting the keyword explicitly
    COUNT(ae.conversions) AS number_of_branded_searches -- Counting conversions explicitly
  FROM
    amazon_attributed_events_by_conversion_time ae
  WHERE
    ae.tracked_item LIKE 'keyword%' -- Ensuring LIKE is used for pattern matching
  GROUP BY
    ae.campaign_id,
    ae.campaign,
    SUBSTRING(ae.tracked_item FROM 9)
),
campaign_costs AS (
  SELECT
    di.campaign_id,
    di.campaign,
    SUM(di.impressions) AS total_impressions,
    SUM(di.impression_cost) / 100000.0 AS total_impression_cost_dollars -- Converting millicents to dollars
  FROM
    dsp_impressions di
  GROUP BY
    di.campaign_id,
    di.campaign
),
-- Merging branded searches with campaign costs for analysis
campaign_analysis AS (
  SELECT
    cc.campaign_id AS campaign_id,
    cc.campaign AS campaign_name,
    bs.keyword AS branded_keyword,
    cc.total_impressions AS impressions,
    cc.total_impression_cost_dollars AS impression_cost_dollars,
    COALESCE(bs.number_of_branded_searches, 0) AS branded_searches_count
  FROM
    campaign_costs cc
  LEFT JOIN
    branded_searches bs ON cc.campaign_id = bs.campaign_id
)
SELECT
  campaign_id,
  campaign_name,
  branded_keyword,
  impressions,
  impression_cost_dollars,
  branded_searches_count,
  CASE
    WHEN impressions > 0 THEN
      CAST(branded_searches_count AS FLOAT) / CAST(impressions AS FLOAT)
    ELSE 0.0
  END AS branded_search_rate,
  CASE
    WHEN branded_searches_count > 0 THEN
      impression_cost_dollars / CAST(branded_searches_count AS FLOAT)
    ELSE 0.0
  END AS cost_per_branded_search
FROM
  campaign_analysis
- Integration of Branded Searches and Campaign Metrics: The branded_searches CTE isolates branded search events while campaign_metrics aggregating campaign-level metrics like impressions and cost. The combined_data CTE then merges these datasets to provide a comprehensive view.
- Efficient Calculation of Metrics: By combining data incombined_data, we enable direct calculation of the branded search rate and cost per branded search within a single SELECT statement, improving query efficiency and readability.
- Conditional Aggregations: The use of CASE statements ensure safe division, avoiding division by zero and ensuring the calculations only proceed when valid data is available.
- Explicit Data Handling: Converting impression costs from millicents to dollars in the campaign_metrics CTE ensures clarity and consistency in cost reporting across different data sources.
This approach streamlines the analysis process and ensures that the insights derived from the DSP campaign performance regarding branded searches are accurate, comprehensive, and actionable, aligning with the intended use case of optimizing analysis for brand search.
From AMC SQL to AMC Insights
What can you do with the results of AMC SQL queries? A lot! Here are just a few examples of the types of analysis you can undertake data analysis and visualization to optimize advertising strategies on the same result set.
CTR Performance by Device Type
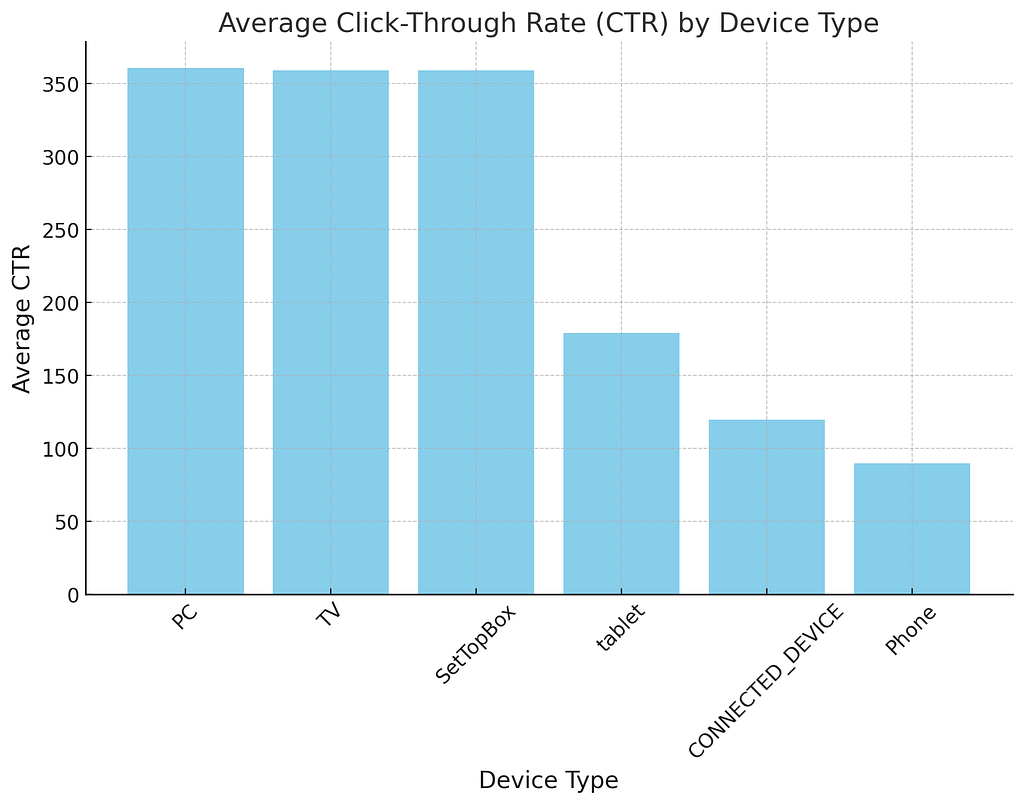
The AMC SQL results allow us to calculate the average CTR for each device type across all campaigns to identify which devices yield higher engagement. This could help focus advertising efforts on the most effective devices.
A bar chart comparing the average CTR across different device types (e.g., Connected Device, PC, Phone, SetTopBox, TV) would visually highlight the devices with higher engagement.
The analysis reveals each device type's average Click-Through Rate (CTR), indicating significant variations across different devices. Here’s a summary of the findings, sorted from highest to lowest average CTR:
- PC: 360.75
- TV: 359.21
- SetTopBox: 359.08
- Tablet: 179.18
- Connected Device: 119.73
- Phone: 89.69
These results suggest that advertising on PCs, TVs, and SetTopBoxes yields the highest engagement in terms of CTR, while Phones and Connected Devices have the lowest. Advertising strategies might be optimized by allocating more resources to the higher-performing device types or by exploring ways to improve engagement on the underperforming ones.
Next, let’s visualize these findings with a bar chart to better illustrate the differences in CTR across device types.

The bar chart visually represents the average Click-Through Rate (CTR) by device type, highlighting the significant variance in CTR across different devices. PCs, TVs, and SetTopBoxes show the highest average CTR, suggesting these platforms are more effective for engaging users with advertisements. Conversely, Phones and Connected Devices exhibit lower CTRs, indicating potential areas for optimization or strategy adjustment.
This analysis suggests focusing advertising efforts on the higher-performing devices or investigating strategies to enhance engagement on platforms with lower CTRs. Adjusting creative content, ad placement, or targeting criteria could improve performance on underperforming devices.
Impressions and Clicks Relationship
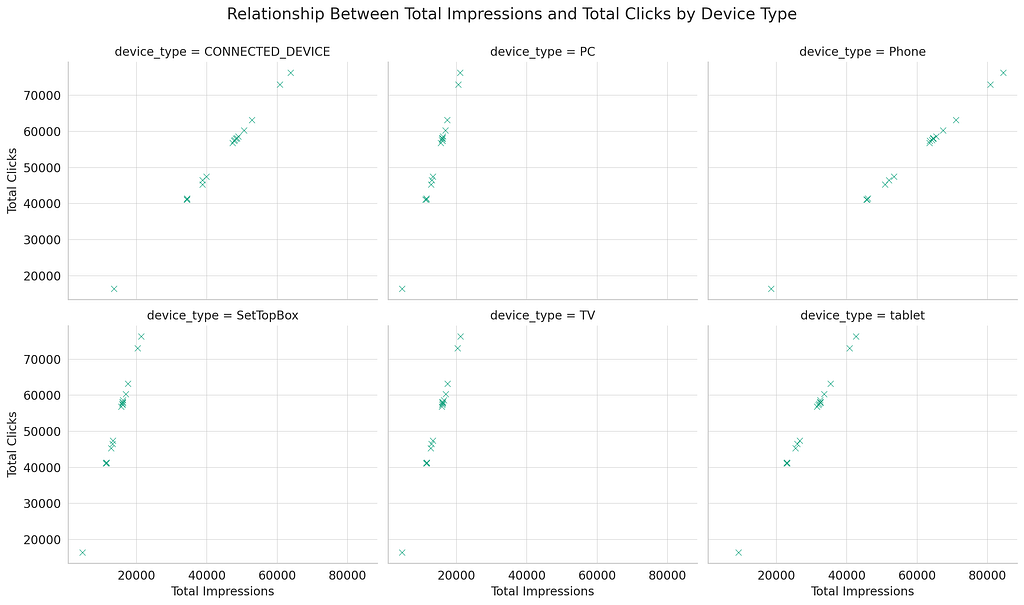
The outputs of the AMC SQL allow us to investigate the relationship between the number of impressions and clicks across different device types. This could identify if more impressions always lead to more clicks or if there’s a saturation point beyond which additional impressions don’t translate into proportionally more clicks.
Scatter plots for each device type, with total impressions on the X-axis and total clicks on the Y-axis, could help visualize this relationship. Adding a trend line would make it easier to see if the relationship is linear or if diminishing returns are evident.

The scatter plots illustrate the relationship between total impressions and clicks for each device type. Here are some observations:
- For most device types, there appears to be a positive relationship between the number of impressions and the number of clicks, indicating that, generally, more impressions lead to more clicks.
- The density and distribution of points vary across device types, suggesting differences in how users engage with ads on these platforms.
- Certain device types might show signs of saturation or diminishing returns, where beyond a certain point, increases in impressions do not lead to proportional increases in clicks. This effect would be easier to identify with a larger dataset or by applying trend lines.
These insights can help inform advertising strategies by identifying optimal levels of ad exposure across different devices and adjusting campaign efforts to maximize engagement without overspending on impressions that do not convert to clicks.
Campaign Performance Analysis
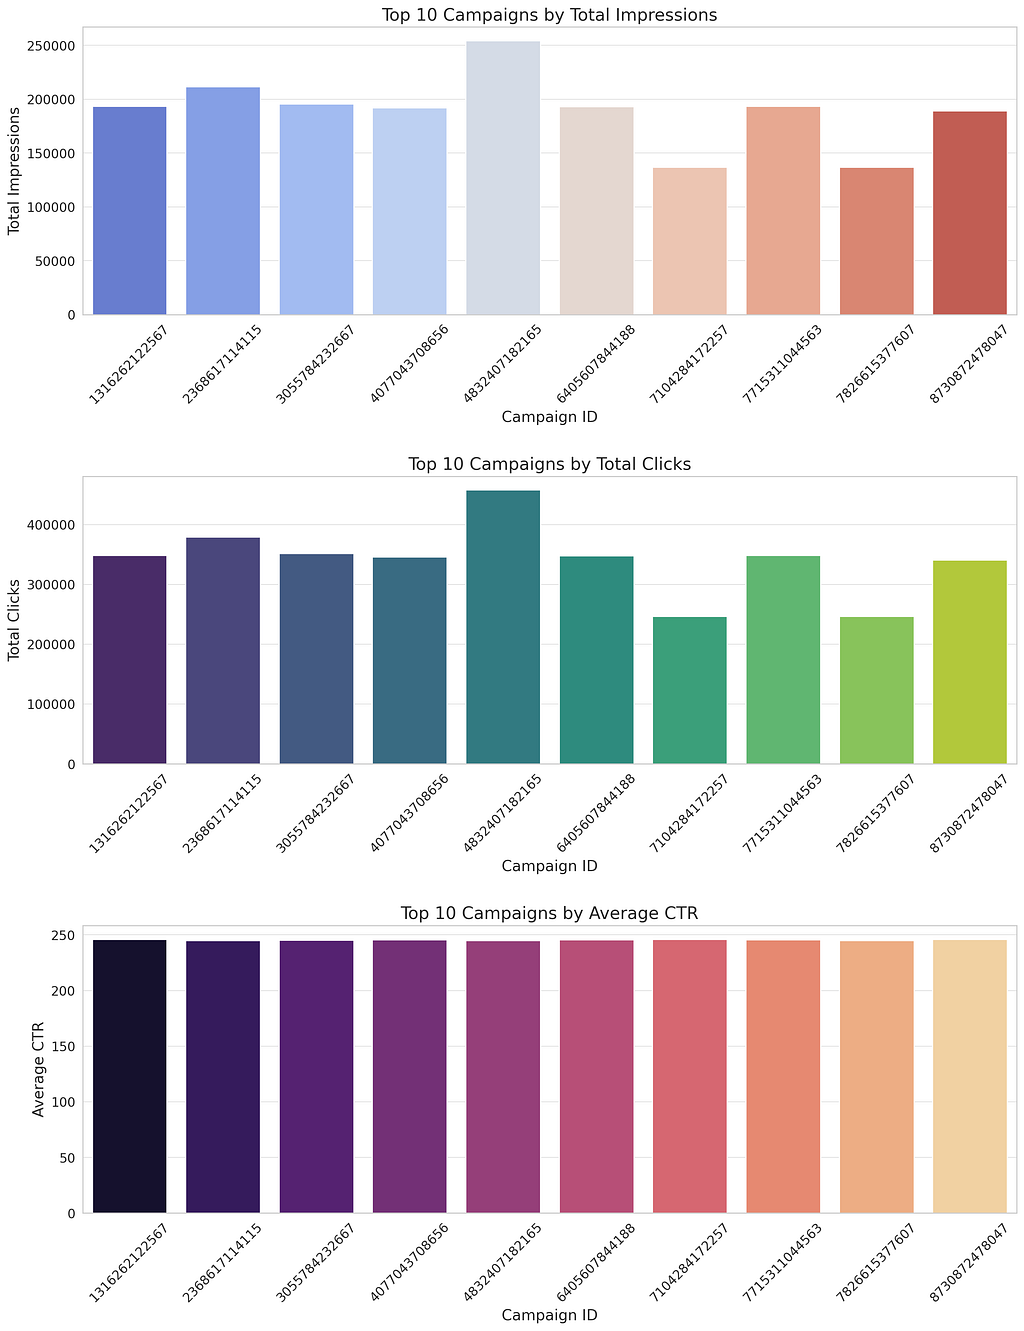
Calculate each campaign's key performance indicators, such as impressions, clicks, and average CTR. This can help identify high-performing campaigns and understand the characteristics that contribute to their success.
The dashboard-like visualization presents the performance metrics of the top 10 campaigns, focusing on Total Impressions, Total Clicks, and Average Click-Through Rate (CTR). This comparative view allows for a more straightforward analysis of what makes these campaigns successful and offers insights into optimizing future advertising strategies:

- The Total Impressions chart shows each campaign's reach. Campaigns with higher impressions have the potential for broader visibility.
- The Total Clicks chart reflects the engagement level, indicating how often users interacted with the ads.
- The Average CTR chart highlights each campaign's efficiency in converting impressions into clicks, a key measure of ad effectiveness.
Analyzing these metrics together provides a comprehensive view of campaign performance, helping identify strengths to replicate and areas for improvement. For example, campaigns with high impressions but lower CTRs may need to refine targeting or creative content, while those with high CTRs demonstrate successful engagement strategies worth emulating.
References
Building An Amazon Marketing Cloud Clean Room
The Insider's Playbook to Mastering Amazon Marketing Cloud SQL was originally published in Openbridge on Medium, where people are continuing the conversation by highlighting and responding to this story.
from Openbridge - Medium https://ift.tt/MHgiN7V
via Openbridge